Objective
|
Vocabularyinterval
|
Essential Understanding
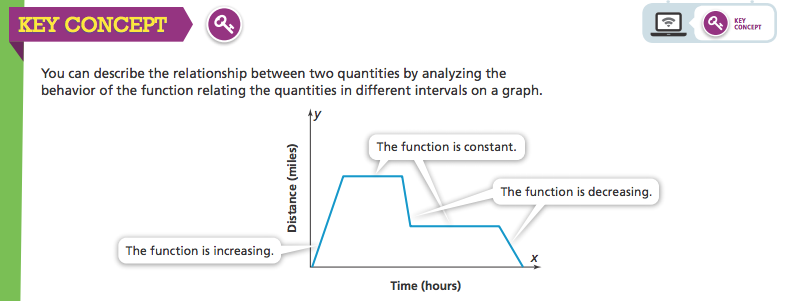
The relationship between two quantities can be represented in a qualitative graph that shows the behavior of the function in different intervals.
StandardsMAFS.8.F.2.5
Describe qualitatively the functional relationship between two quantities by analyzing a graph (e.g., where the function is increasing or decreasing, linear or nonlinear). Sketch a graph that exhibits the qualitative features of a function that has been described verbally. |
Mathematical PracticesMP.1, MP.2, MP.3, MP.7
|
Video Tutorials

How do you make an approximate graph from a word problem?
|

How do you figure out a situation that a graph represents?
|
Key Concept